Debugging the Drivers
Kernel drivers do not write normal log files to disk. Instead, they use Event Tracing for Windows (ETW), which you can capture from the command line.
Prepare verbose tracing
-
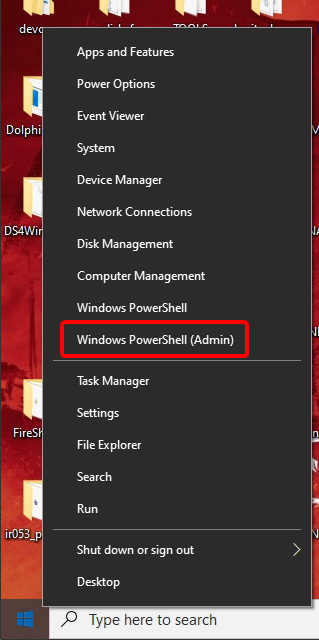
Open PowerShell as Administrator (press Win+X and choose it from the menu):
Keep this window open; you will use it for the following steps.
-
By default, verbose tracing is off. To enable it, run these commands in PowerShell:
PowerShell
Set-ItemProperty -Path "HKLM:\SYSTEM\CurrentControlSet\Services\BthPS3\Parameters" -Name "VerboseOn" -Type DWord -Value 1 -Force Set-ItemProperty -Path "HKLM:\SYSTEM\CurrentControlSet\Services\BthPS3\Parameters\Wdf" -Name "VerboseOn" -Type DWord -Value 1 -Force Set-ItemProperty -Path "HKLM:\SYSTEM\CurrentControlSet\Services\BthPS3PSM\Parameters" -Name "VerboseOn" -Type DWord -Value 1 -Force Set-ItemProperty -Path "HKLM:\SYSTEM\CurrentControlSet\Services\BthPS3PSM\Parameters\Wdf" -Name "VerboseOn" -Type DWord -Value 1 -Force -
Reboot the machine before continuing.
You only need to do this once; later trace sessions do not require another reboot.
Capture the trace
Start trace session
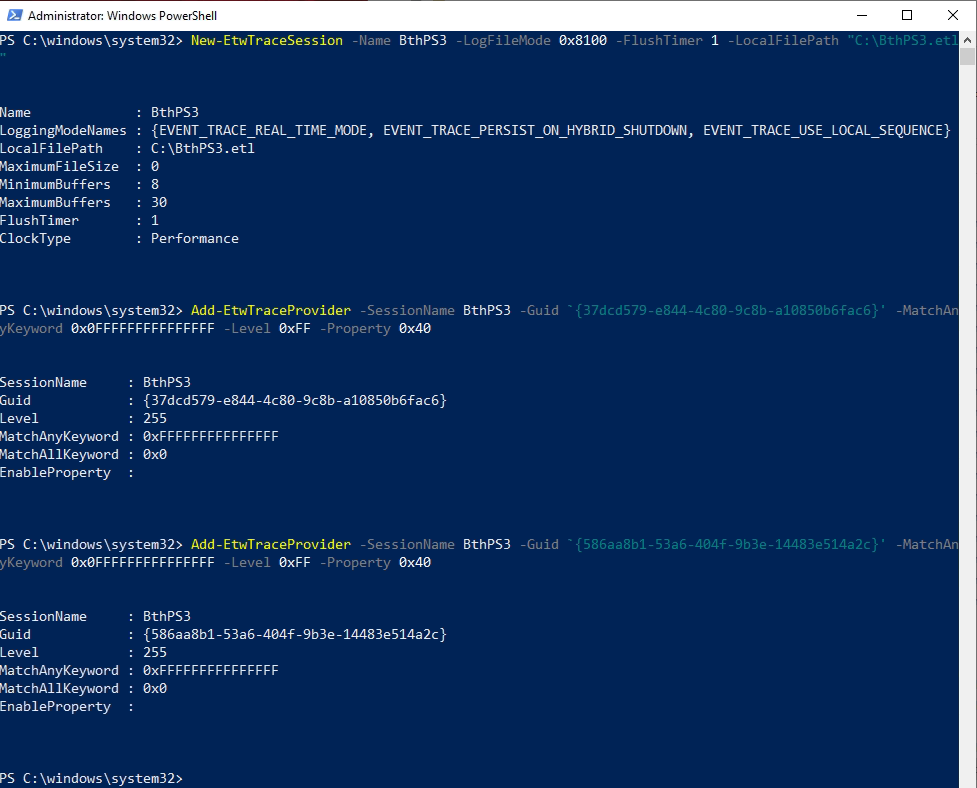
In PowerShell (as Administrator), run these three commands:
PowerShell
New-EtwTraceSession -Name BthPS3 -LogFileMode 0x8100 -FlushTimer 1 -LocalFilePath "C:\BthPS3.etl"
Add-EtwTraceProvider -SessionName BthPS3 -Guid '{37dcd579-e844-4c80-9c8b-a10850b6fac6}' -MatchAnyKeyword 0x0FFFFFFFFFFFFFFF -Level 0xFF -Property 0x40
Add-EtwTraceProvider -SessionName BthPS3 -Guid '{586aa8b1-53a6-404f-9b3e-14483e514a2c}' -MatchAnyKeyword 0x0FFFFFFFFFFFFFFF -Level 0xFF -Property 0x40
The output should look similar to this (it may differ on your system):
Reproduce the behaviour you want to capture
While the trace is running, perform the actions you want to investigate. For example:
- Controller not connecting over Bluetooth: Try connecting it several times (turn on with the PS button, wait until the LEDs stop blinking, then try again).
- Controller turning off randomly: Use the controller until it disconnects on its own.
- Something works over USB but not Bluetooth (e.g. LEDs, rumble, sticks): Repeat the same actions over Bluetooth that work over USB.
Stop the trace session
When you have captured enough, stop the session so the log file is closed:
PowerShell
Remove-EtwTraceSession -Name BthPS3
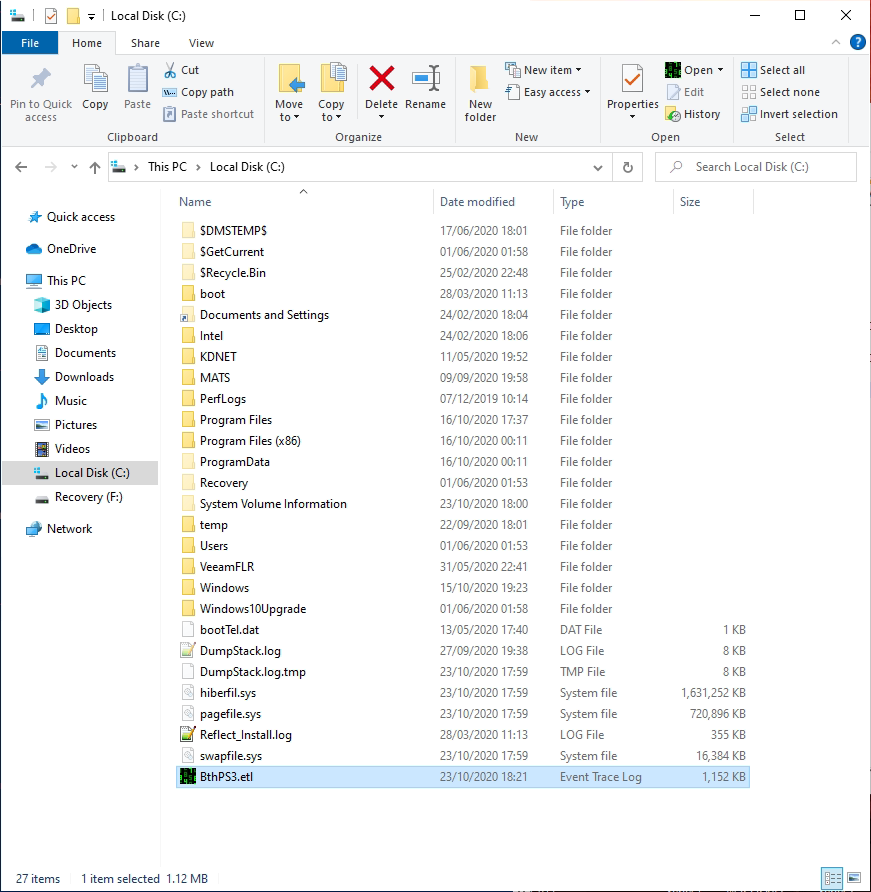
The log file will be at C:\BthPS3.etl:
What to do with the trace file
You now have a BthPS3.etl file. You can submit it (compressed with WinRAR or 7-Zip) to Nefarius for analysis, or inspect it yourself as described below.
Trace file contents
The trace file may contain device identifiers needed for debugging. Share it securely with trusted recipients only.
Decoding the trace file
Trace files are not plain text. You need a tool that can decode ETW content. Microsoft provides such tools, but they are verbose and not very beginner-friendly; a third-party tool is recommended.
Using MGTEK TraceView Plus 3
- Download and install MGTEK TraceView Plus 3.
MGTEK TraceView Plus 3 is not freeware
A free 30-day evaluation is available. For longer use, you can purchase a licence.
-
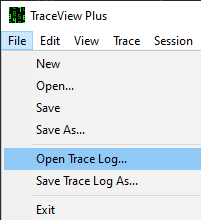
Double-click
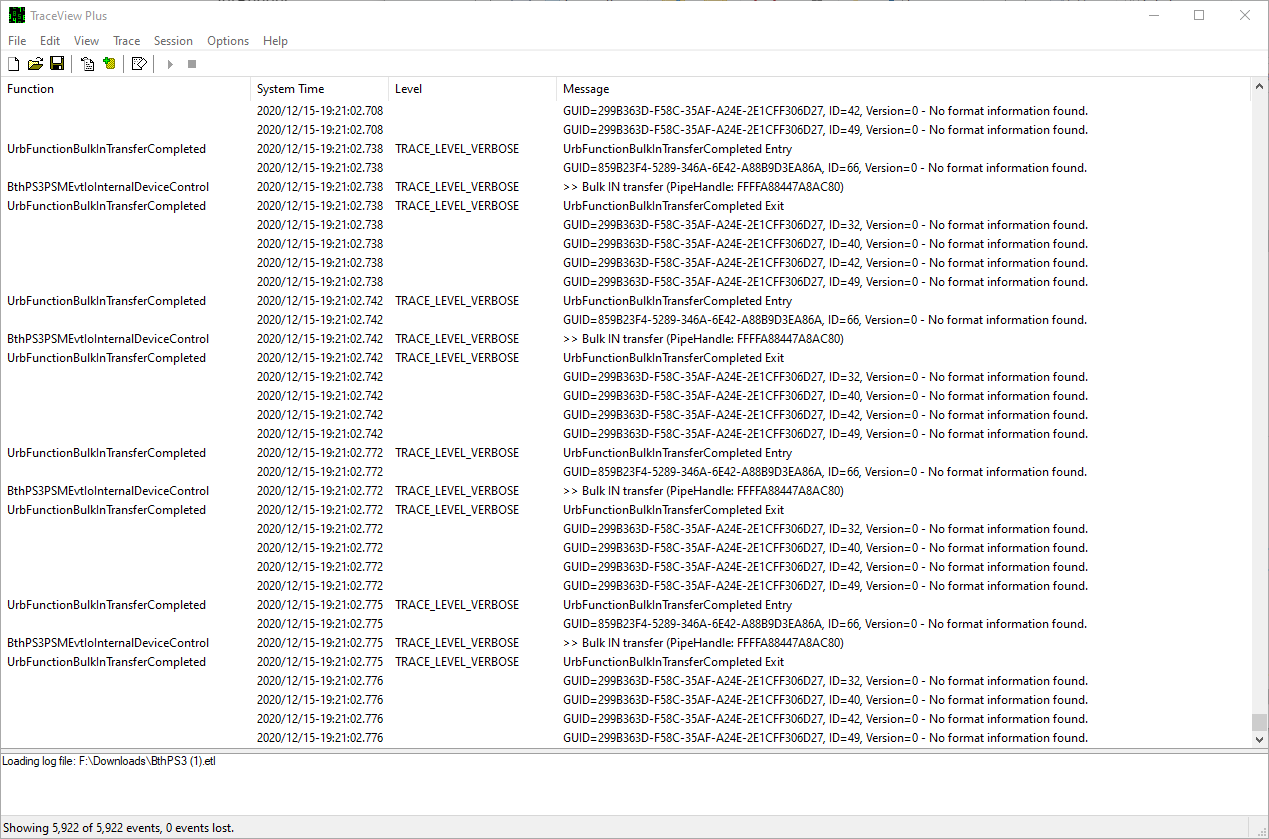
BthPS3.etlto open it in TraceView Plus, or use File → Open Trace Log... and select the file:
-
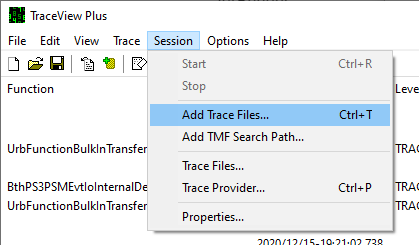
TraceView Plus needs symbol files to decode the trace. Go to Session → Add Trace Files...:
-
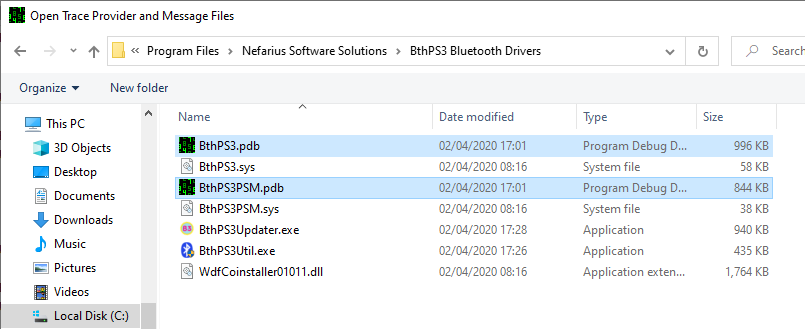
In the BthPS3 installation folder on your system, select both PDB files:
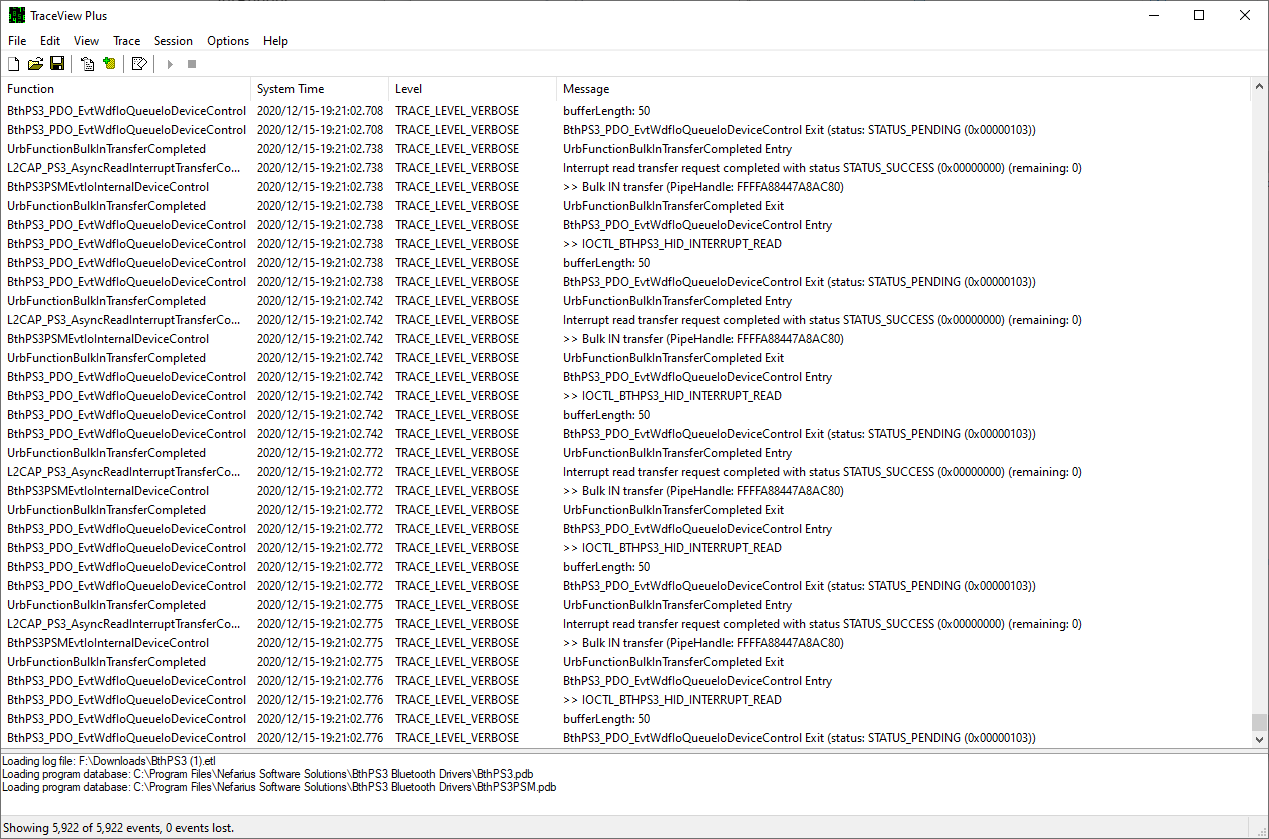
You can then browse the trace; newest events are at the bottom, oldest at the top.
Interpreting the trace
Once the trace is decoded, look for TRACE_LEVEL_WARNING or TRACE_LEVEL_ERROR entries. These indicate driver failures and can point to the cause of connection or behaviour issues. Whether the issue can be fixed depends on the specific message and your setup.
